Issue Explorer
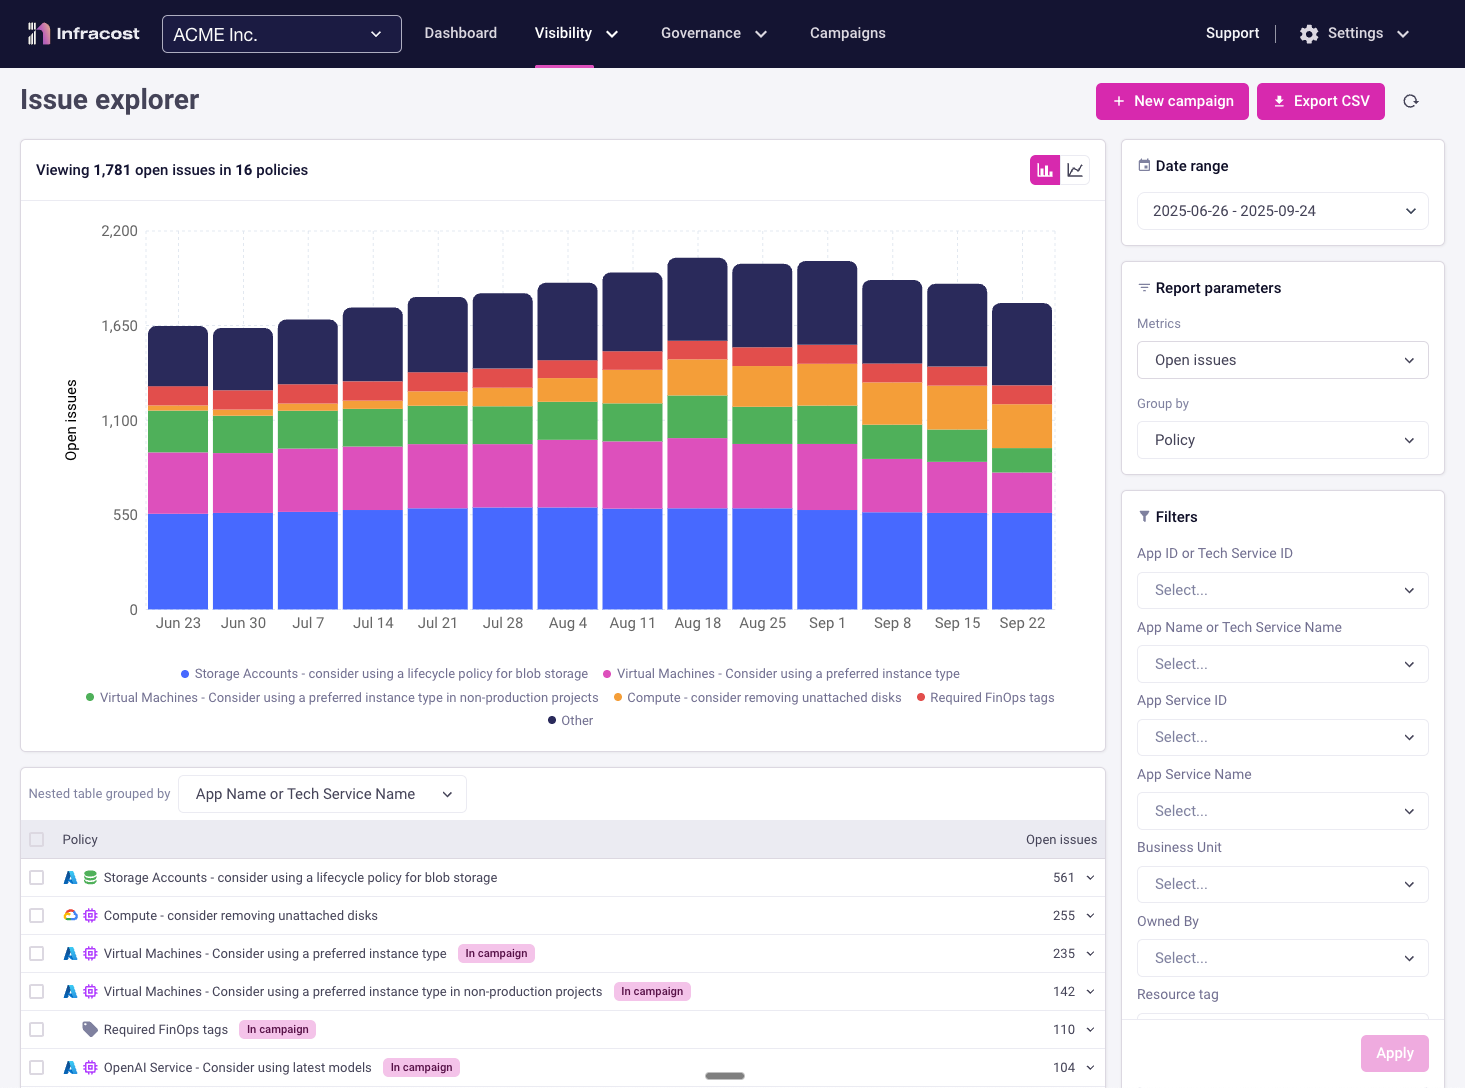
Issue Explorer provides centralized visibility into cloud cost optimization opportunities and FinOps policy violations across your entire organization. Track, prioritize, and address infrastructure issues to help reduce your cloud bill and improve governance.
How it works
Issue Explorer continuously scans your infrastructure code across all repositories and projects, identifying cost optimization opportunities and policy violations. It aggregates these findings into a unified dashboard, enabling FinOps teams to track governance compliance and engineering teams to prioritize fixes based on potential savings.
Key Benefits
- Centralized visibility: Track all infrastructure issues across multiple repositories and teams in one place
- Prioritized actions: Focus on high-impact issues with the greatest cost-saving potential
- Team accountability: Assign and track issue resolution across engineering teams
- Compliance tracking: Monitor adherence to FinOps policies and governance standards
- Historical trends: Understand how your organization's cloud governance improves over time
Before You Begin
Here's what you need to get started:
- ✅ Infracost Cloud account with appropriate permissions
- ✅ At least one repository integrated (GitHub, GitLab, or Azure Repos)
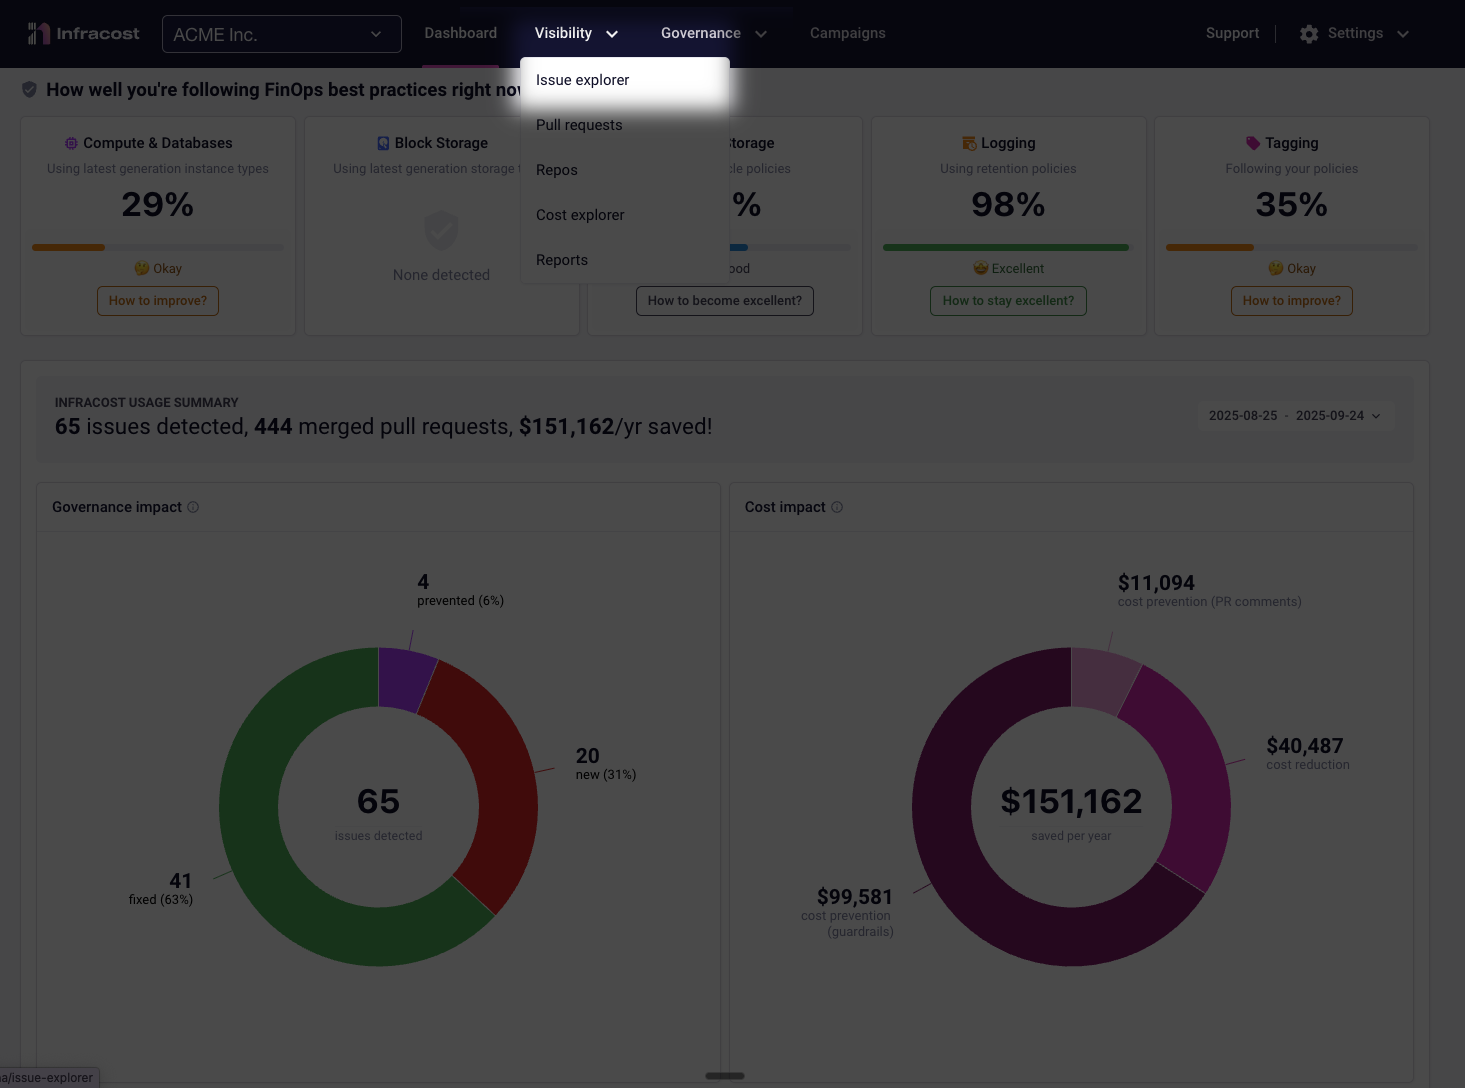
Getting Started
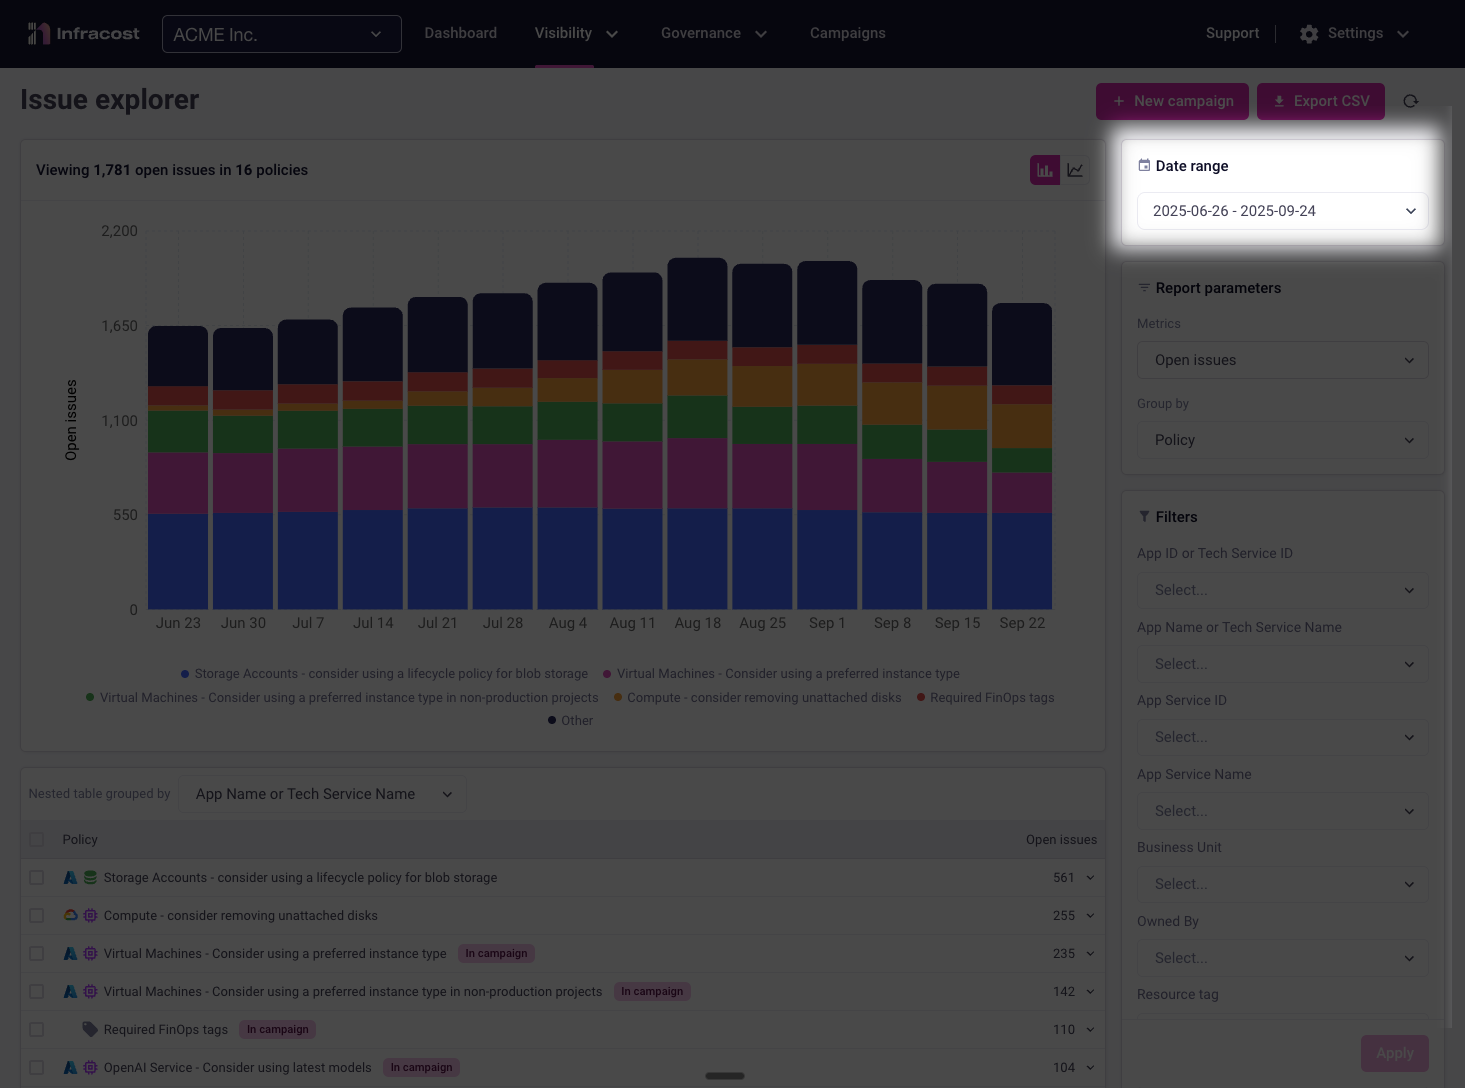
You can access Issue Explorer by selecting Visibility > Issue explorer from the main
navigation menu:
Switching Chart Type
Click either chart icon to instantly switch views—your filters and date ranges remain unchanged, letting you explore the same data from different perspectives.
Metrics & Grouping
Available Metrics
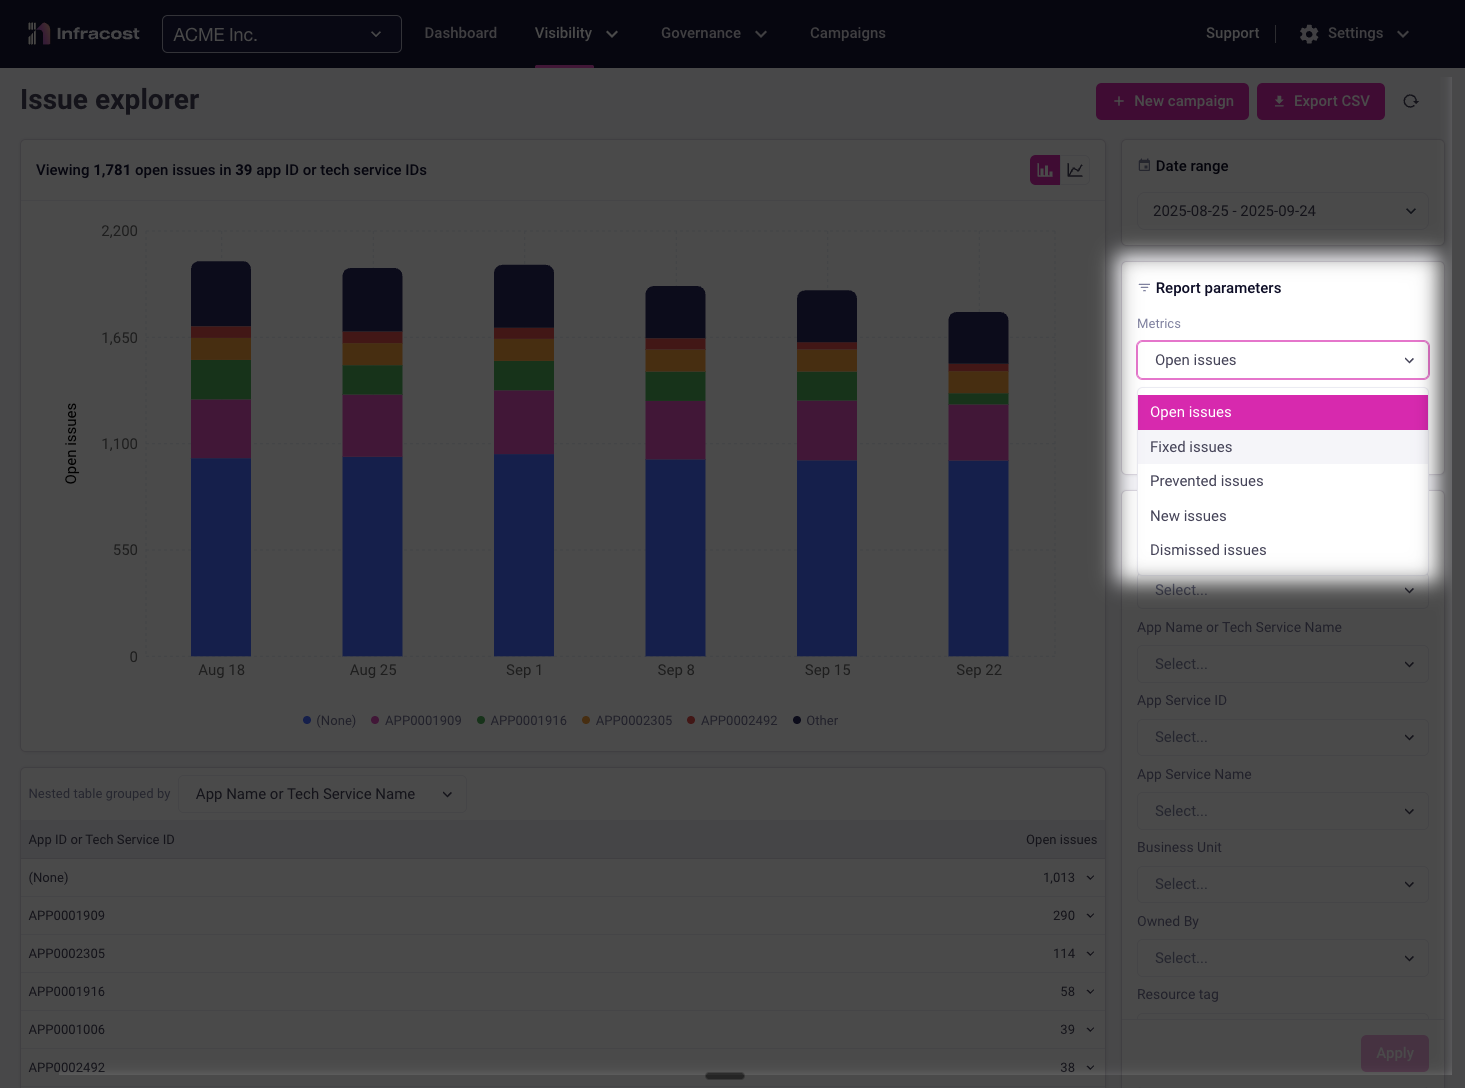
Customize your analysis by selecting which metrics to track and how to organize them. This flexibility enables you to answer specific questions and uncover actionable insights.
Choose which issue metric to sum in your reports:
| Attribute | Shows | Use when |
|---|---|---|
| Open Issues | Current unresolved issues requiring attention | Identifying where to focus remediation efforts, understanding current technical debt, or planning campaigns |
| Fixed Issues | Issues that have been successfully resolved | Demonstrating team progress, celebrating wins, or identifying which teams/policies are seeing the most improvement |
| Prevented Issues | Issues caught, and either prevented before reaching production or fixed by follow-up changes | Measuring shift-left success, validating CI/CD policies, or showing ROI of prevention tooling |
| New Issues | Recently introduced issues within your selected timeframe | Identifying regression trends, spotting problematic deployments, or understanding if governance is improving |
| Dismissed Issues | Issues marked as false positives or accepted risks | Auditing policy effectiveness, understanding exception patterns, or refining policy rules |
Grouping Options
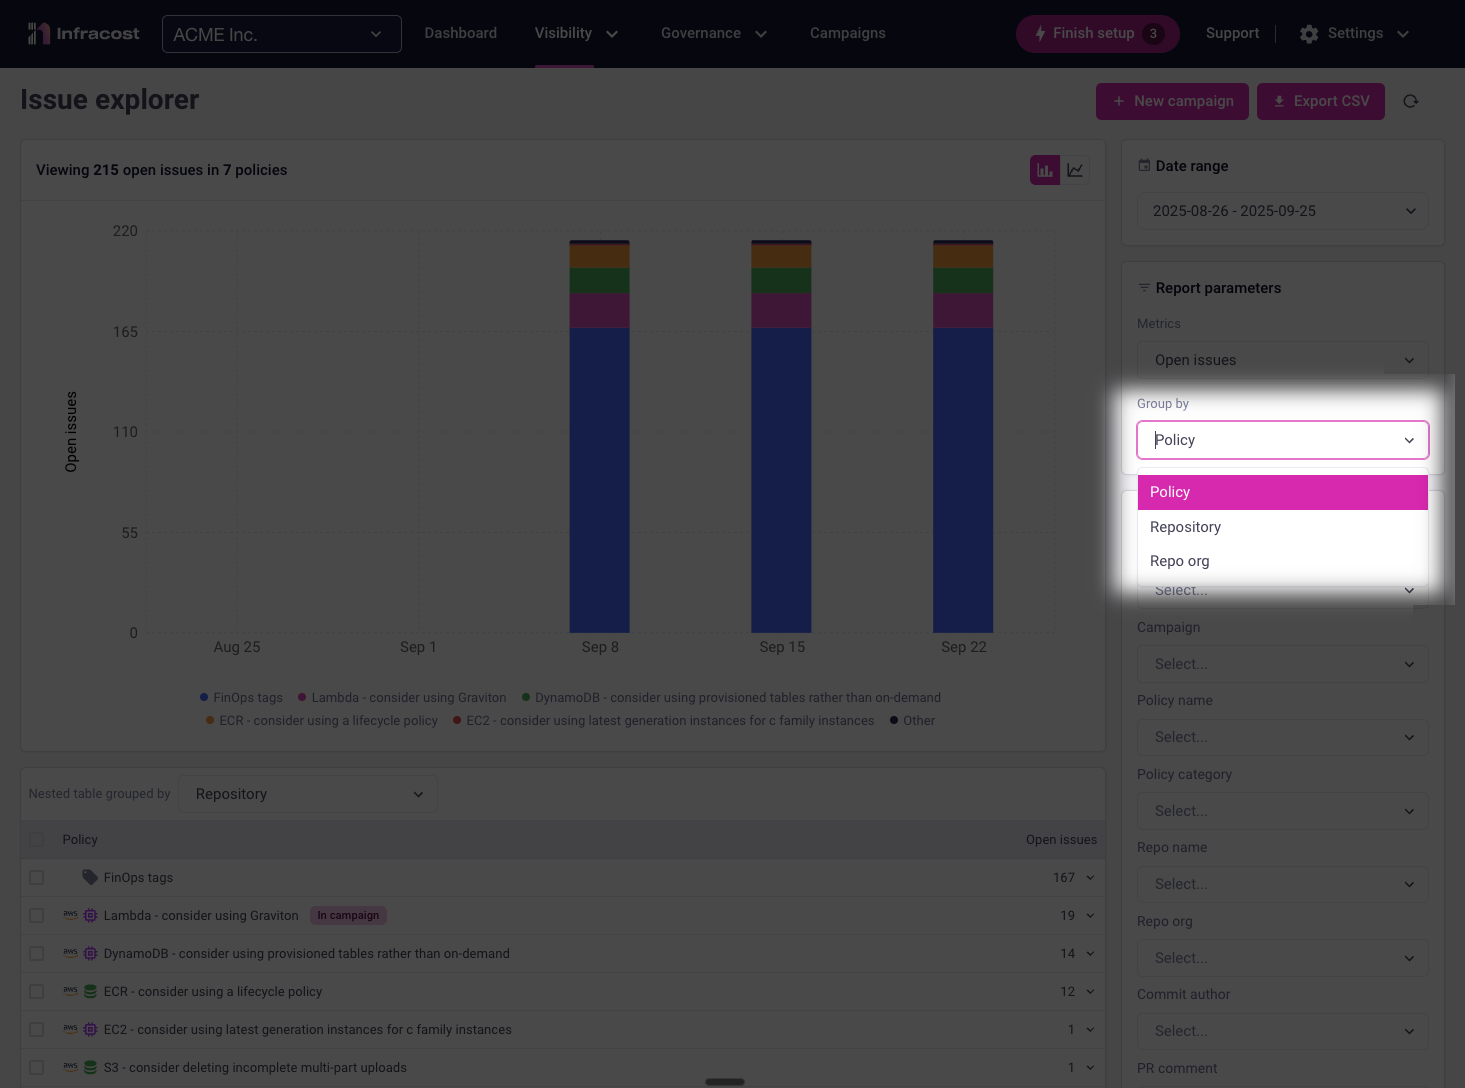
Organize your selected metric by different attributes to reveal patterns:
| Group by | Reveals | Example insights |
|---|---|---|
| Policy | Which FinOps policies are most/least violated | "gp2 volume" violations are increasing while "preferred instance" violations are decreasing |
| Repository | Which codebases contribute most to your issues | The payments-service repo has fixed 90% of issues while the legacy-api repo shows no improvement |
| Repository Org | Patterns across GitHub/GitLab organizations | The platform-team org prevents 5x more issues than other orgs due to better CI/CD checks |
CustomAttribute | Patterns specific to your organization | (Options can include: Business unit, team, application, service, cost center, or any configured attribute) The Data & Analytics business unit has the highest prevented-to-fixed ratio, showing strong shift-left adoption |
Powerful Combinations
Different metric and grouping combinations answer different questions:
| Question | Metric | Group By |
|---|---|---|
| "Which policies are we struggling with?" | Open Issues | Policy |
| "Which teams are making the most progress?" | Fixed Issues | Business Unit (custom attribute) |
| "Where is our shift-left working?" | Prevented Issues | Repository |
| "Are we getting better or worse?" | New Issues | Policy |
| "Which repos need the most help?" | Open Issues | Repository |
| "What exceptions are we accepting?" | Dismissed Issues | Policy Category |
Filtering
Focus your analysis on exactly the data you need using Issue Explorer's comprehensive filtering system. Combine date ranges with attribute filters to create precise views of your infrastructure issues.
Date Range Filtering
Set custom time periods to analyze trends, or focus on recent changes:
- Preset ranges: Last 7, 30, 90, or 365 days
- Custom ranges: Select specific start and end dates
Available Attribute Filters
Campaign and Policy Filters
- Campaign: View issues associated with specific campaigns
- Policy Name: Filter by individual FinOps policy
- Policy Category: Group by policy types (tagging, cost optimization, security)
Development Filters
- Repo Name: Focus on specific repositories
- Repo Org: Filter by GitHub/GitLab organization
- Commit Author: Track issues by who introduced them
- PR Comment: Find issues flagged (i.e. enabled) in pull request reviews
Organization, Application, and Service Filters
Configure custom attributes to match your organizational structure and enable filtering that aligns with how your teams actually work. These attributes map to your existing metadata—whether from cloud resource tags, repository configurations, or service catalogs — creating a unified view across all your infrastructure.
Common custom attributes teams configure include:
- Business Unit/Team/Owner: Focus on specific departments or teams
- App or Service Name/ID: Filter by unique application/service identifiers
- Resource Tag: Use any cloud resource tag for filtering
Using Filters Effectively
Combining Multiple Filters
Layer filters to create precise queries:
Example: Show unresolved tagging issues from the Data team in Q4
- Date Range: Oct 1 - Dec 31
- Business Unit: Data & Analytics
- Policy Category: Tagging
- Status: Open
Example use cases
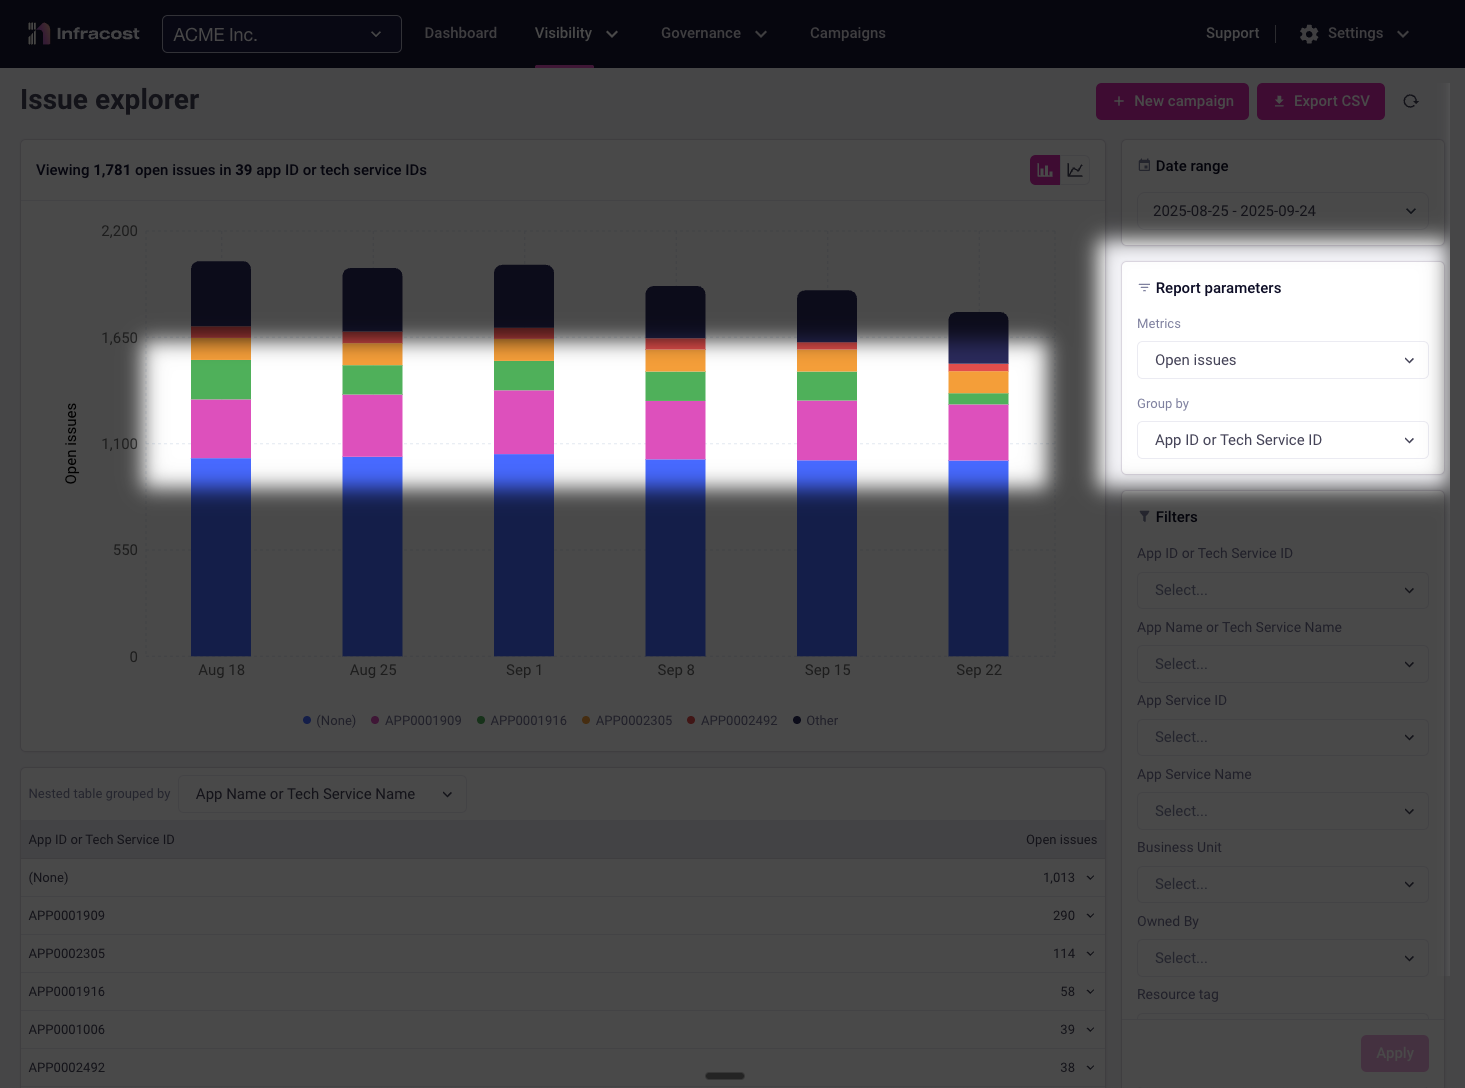
Identifying organization-wide trends
The charts track your organization's cost and policy compliance metrics over time. At the organizational level, you might notice costs and issue counts remaining relatively flat—but if you're only focused on the top line number or the overall number, you've missed the full picture.
Understanding the Full Picture
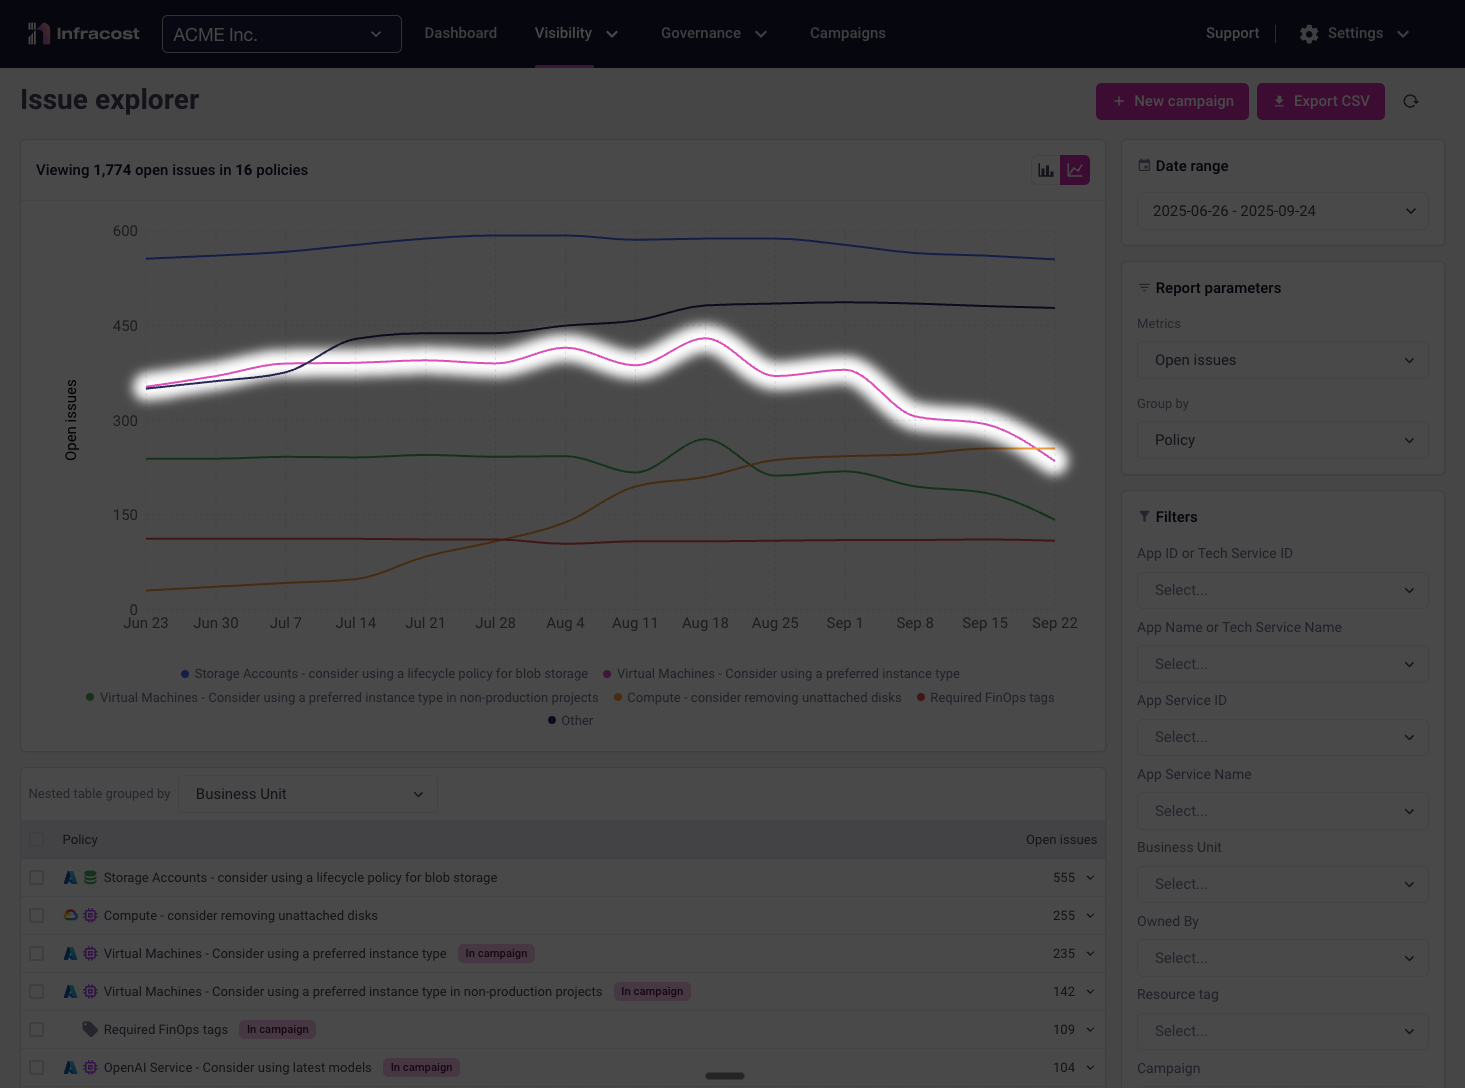
Switching to the line chart type, and breaking down the data by policy type reveals the real dynamics at play. In this example, we can see clear improvement in "Virtual Machines - use a preferred instance" violations, with steady reduction in breaches over the reporting period.
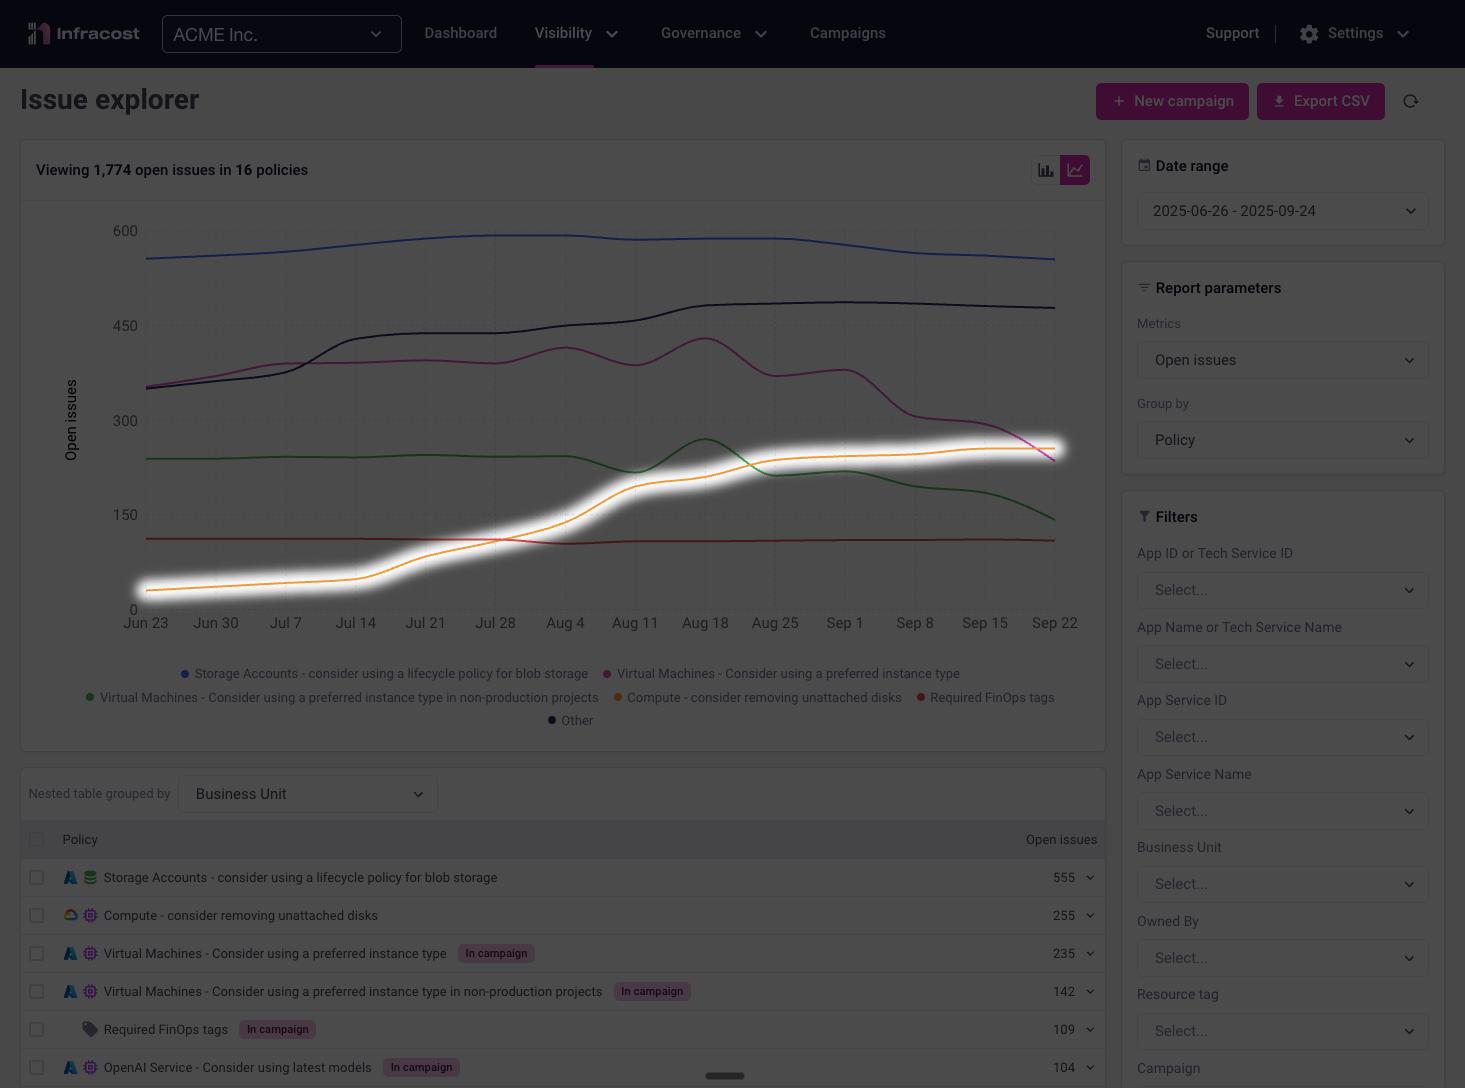
However, these wins aren't immediately obvious in the overall metrics because "Compute - remove unattached disks" violations have simultaneously increased, offsetting the improvements:
Why This Matters
This view enables you to:
- Recognize hidden wins: Teams may be making significant progress that isn't visible in top-line metrics
- Spot emerging risks: New problem areas become apparent before they impact your overall governance posture
- Prioritize effectively: Focus resources on areas showing regression while maintaining momentum where you're succeeding
- Shift left strategically: Use trend data to implement preventive measures in your CI/CD pipeline for problematic policy types
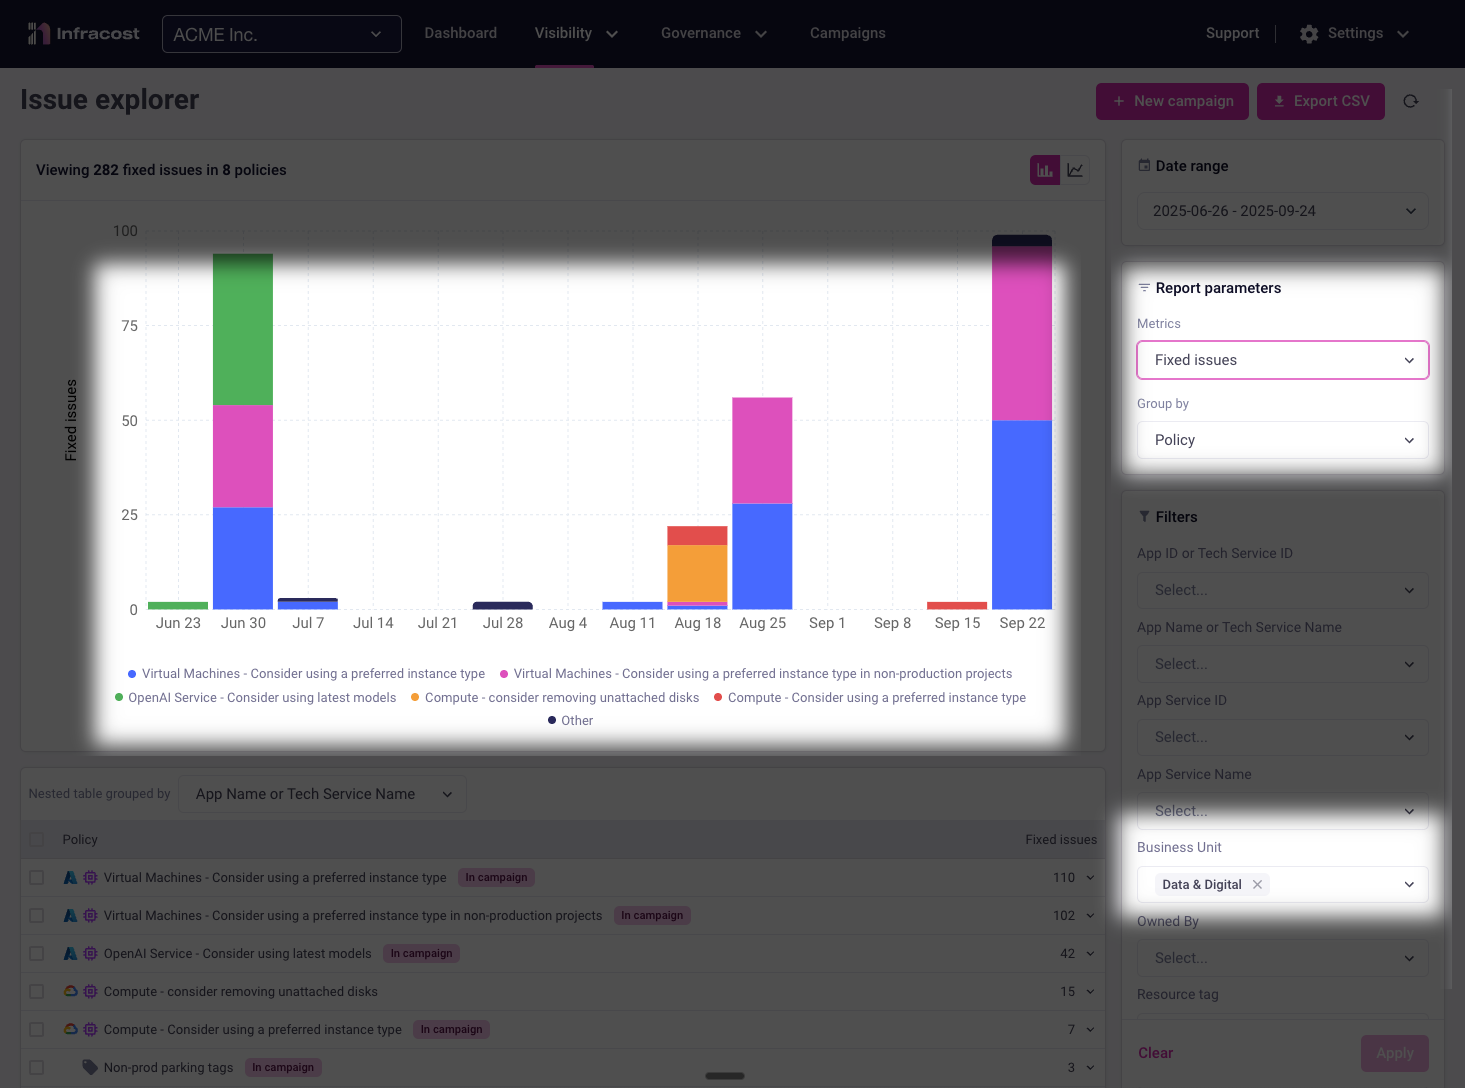
Isolate Team Performance for Targeted Support
When overall metrics plateau, drilling down to team-level data reveals where to focus your support efforts. This targeted approach helps teams build accountability while providing them with the specific help they need to improve.
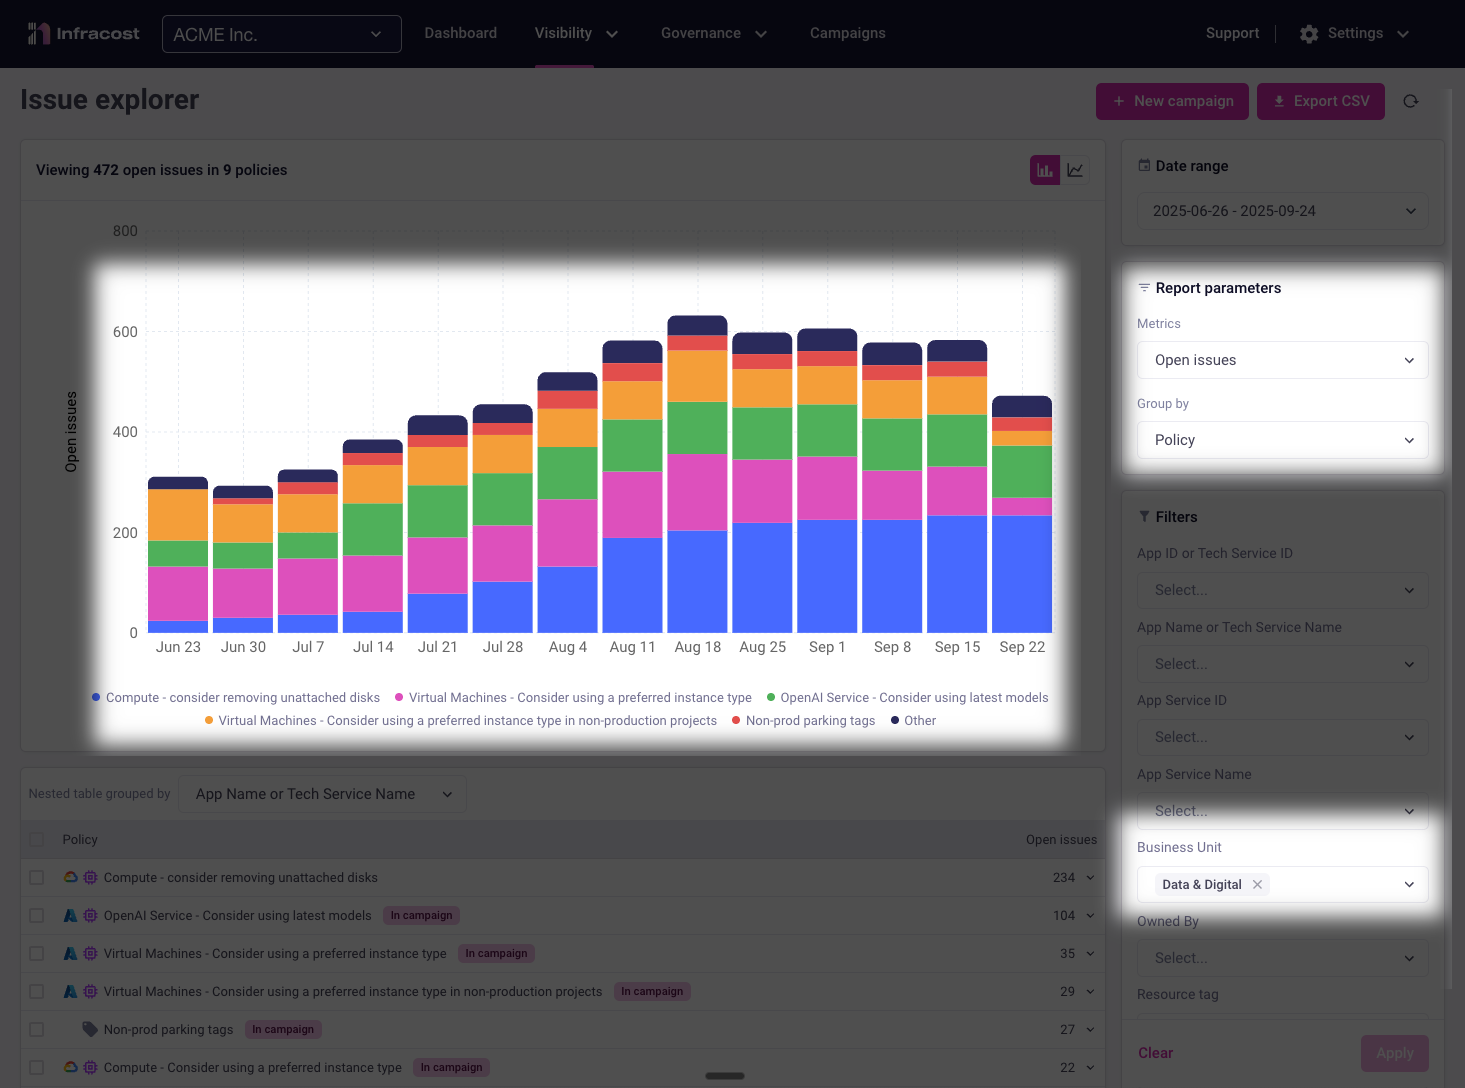
Finding Your Focus Team
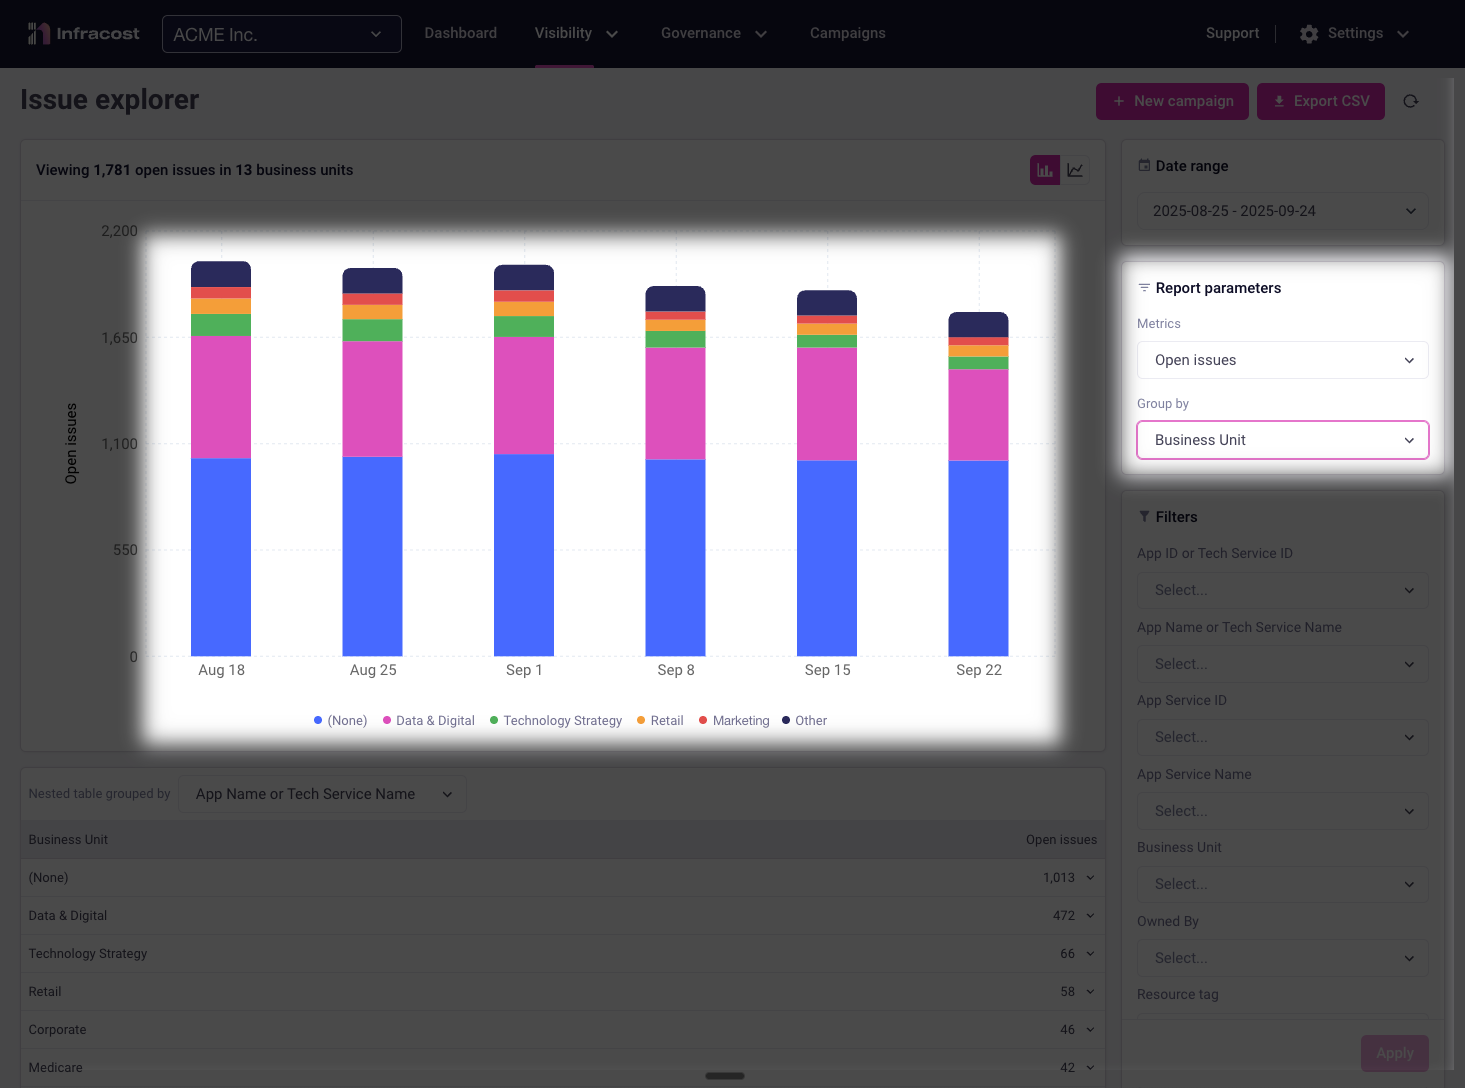
By grouping results by business unit, you can quickly identify which groups need the most support. In this example, the "Data & Digital" team has the largest number of open policy issues making them an ideal candidate for focused assistance.
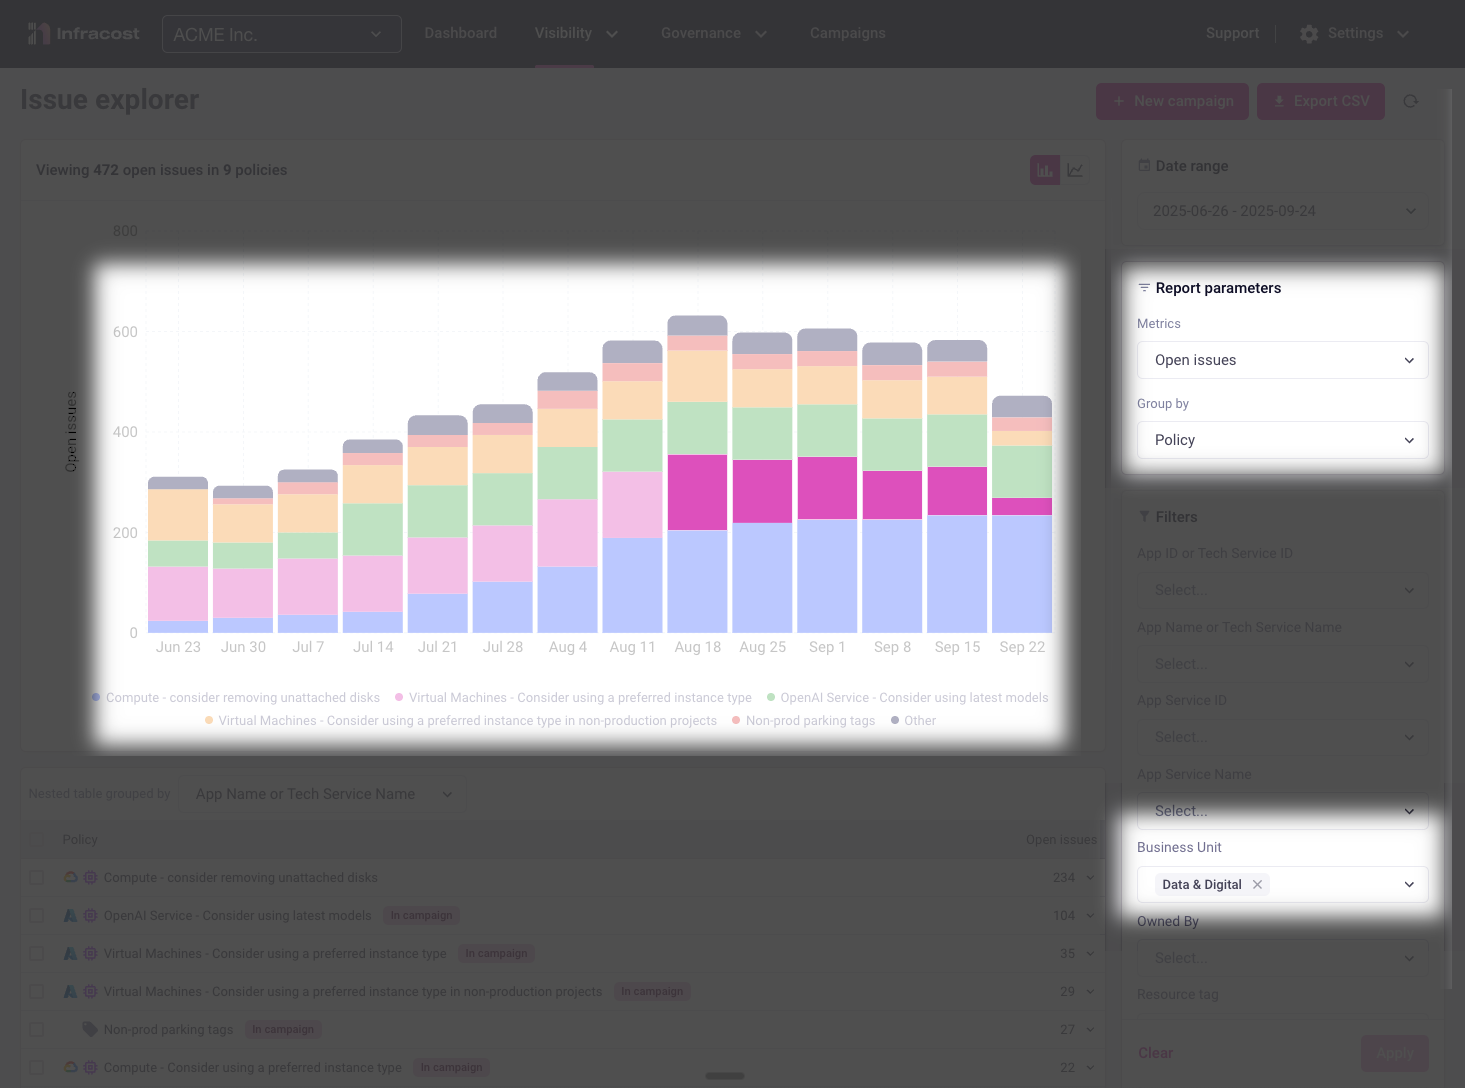
Analyzing Team-Specific Trends
Switching to a team-filtered view reveals important patterns. Here, the "Data & Digital" team shows strong progress on "Virtual Machines - use preferred instance" violations. They're actively fixing these issues:
However, their "Compute - unattached disks" violations are increasing rapidly, more than offsetting their VM improvements:
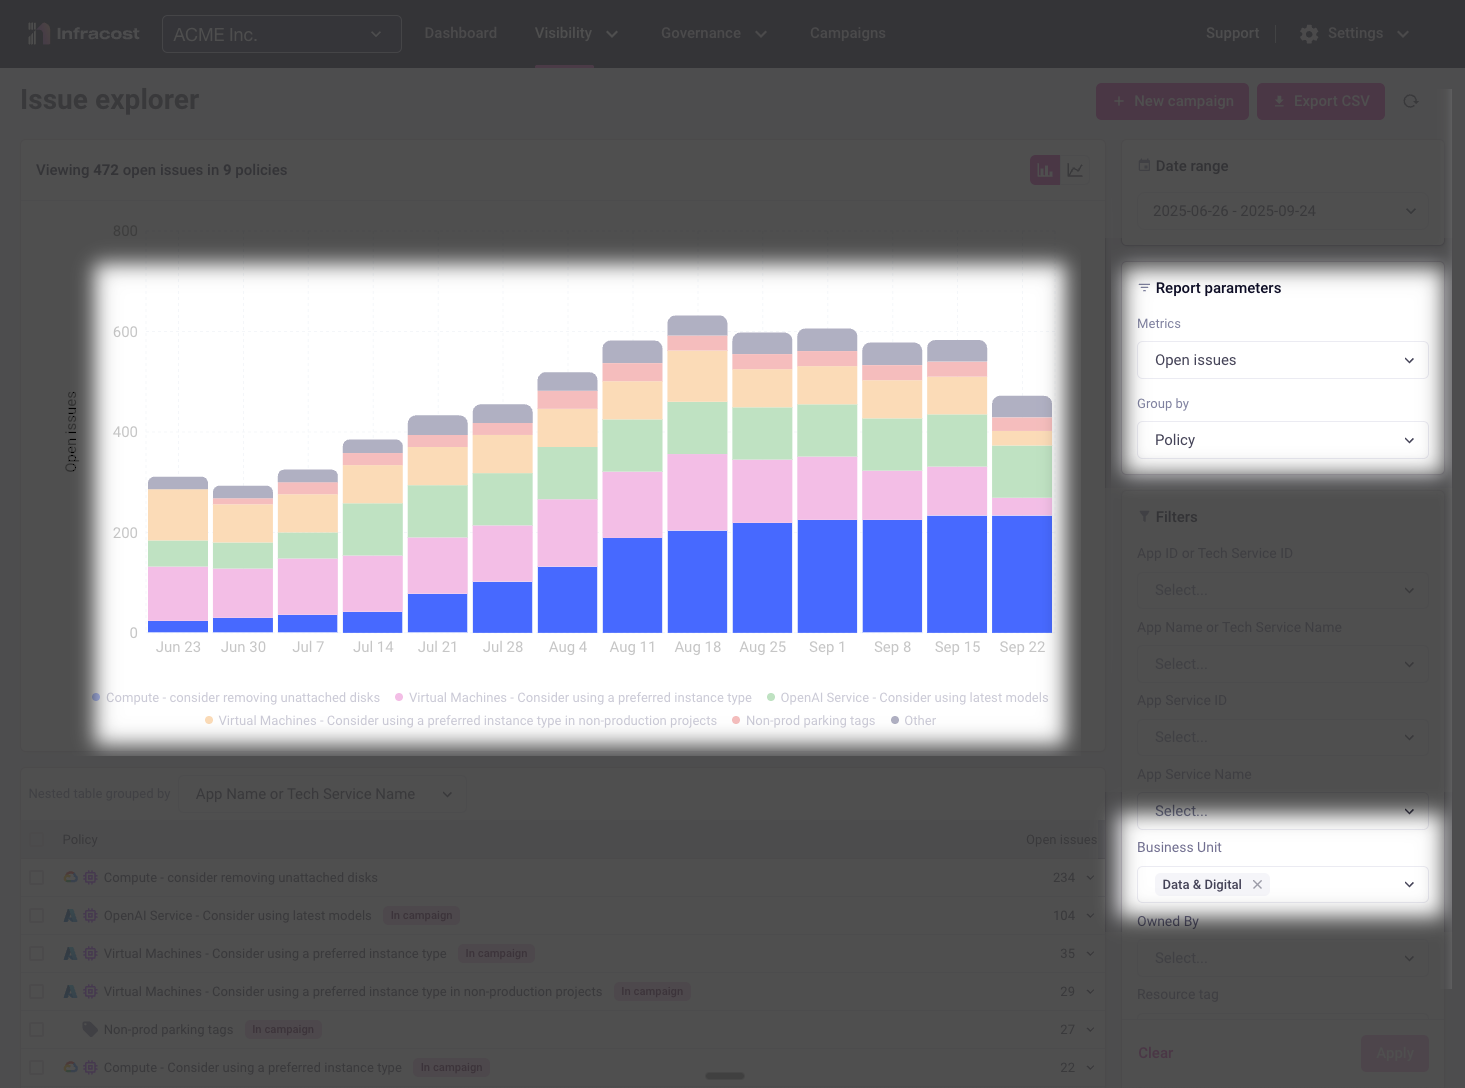
This insight immediately highlights where targeted support could help this team contribute more effectively to organizational goals.
Understanding How Teams Work
To provide the right support, we need to understand how teams are addressing issues.
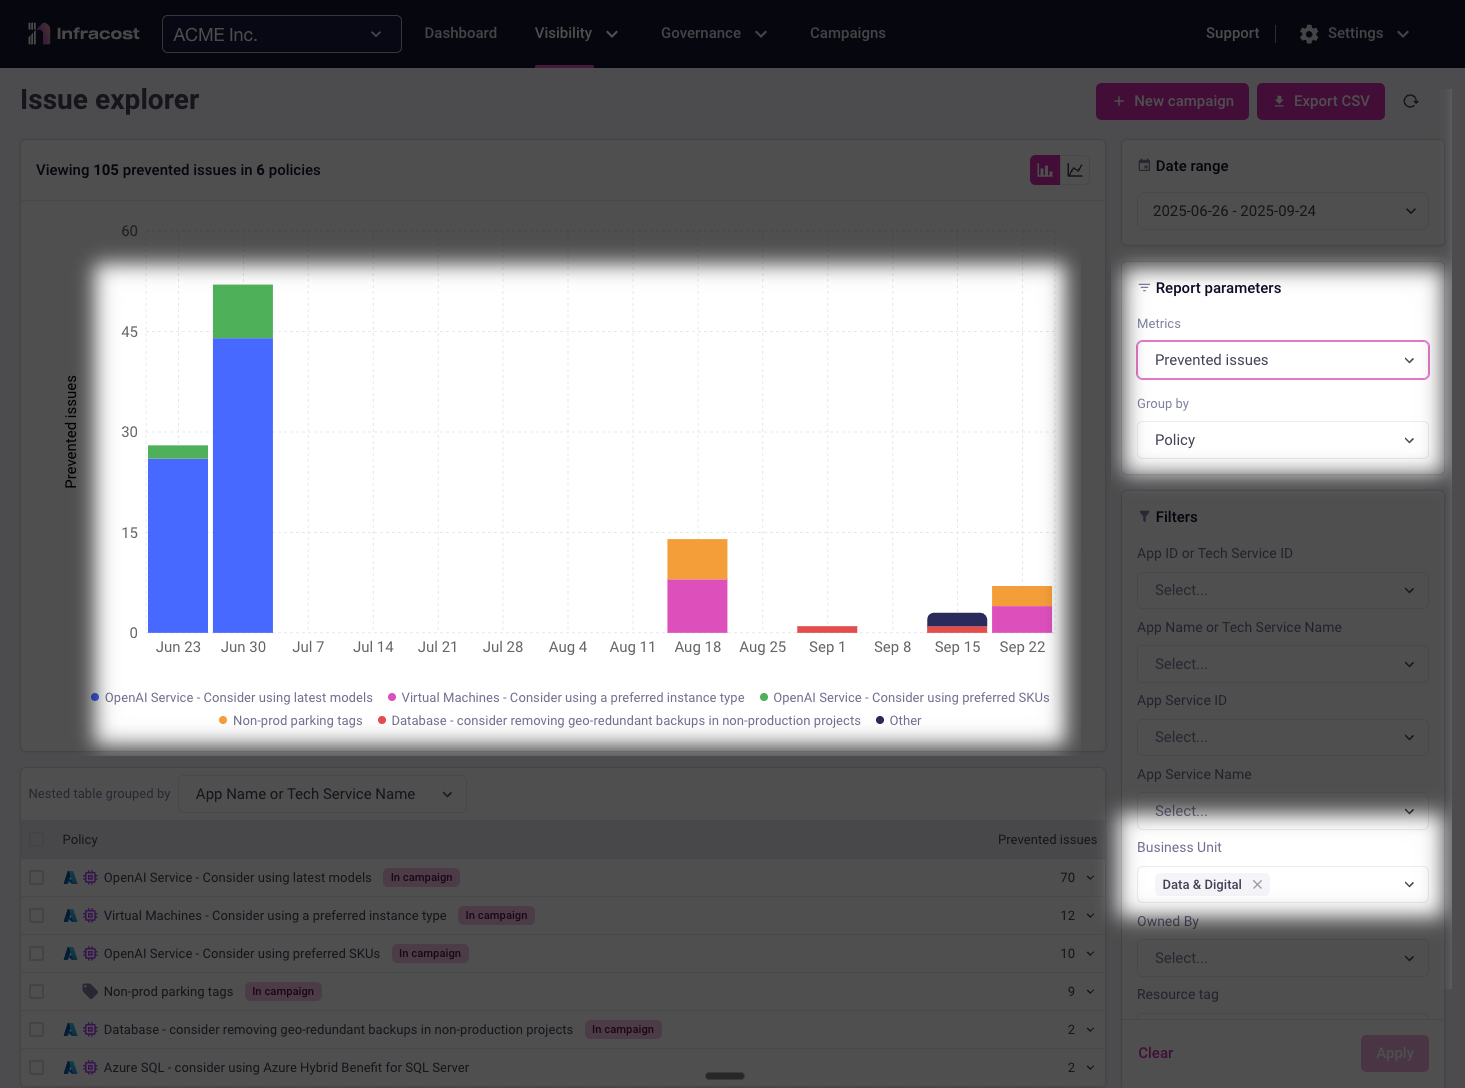
Switching to the prevented issues report shows relatively few issues being caught during development. This reveals a significant opportunity—if this team could catch issues earlier in their workflow, they'd spend less time on remediation.
The fixed issues report confirms our hypothesis: most of the team's effort goes toward remediating issues after they've been introduced. While they're working hard to fix problems, they're essentially doing double work—first creating issues, then fixing them.
Analyzing by app/service/workload
Breaking down issues by application, service, or workload reveals which parts of your infrastructure need the most attention and which areas are making the most progress.
Identifying Problem Applications
Viewing open issues grouped by application immediately highlights your optimization priorities. Applications with the highest issue counts often represent:
- Quick wins: Legacy applications that haven't been optimized recently
- Cost centers: High-spend applications where even small improvements yield significant savings
- Technical debt: Applications that have grown organically without governance
- Training opportunities: Teams that may need additional FinOps education
This view helps you allocate resources effectively—focusing your best engineers on the applications with the highest potential impact.
Tracking Resolution Progress
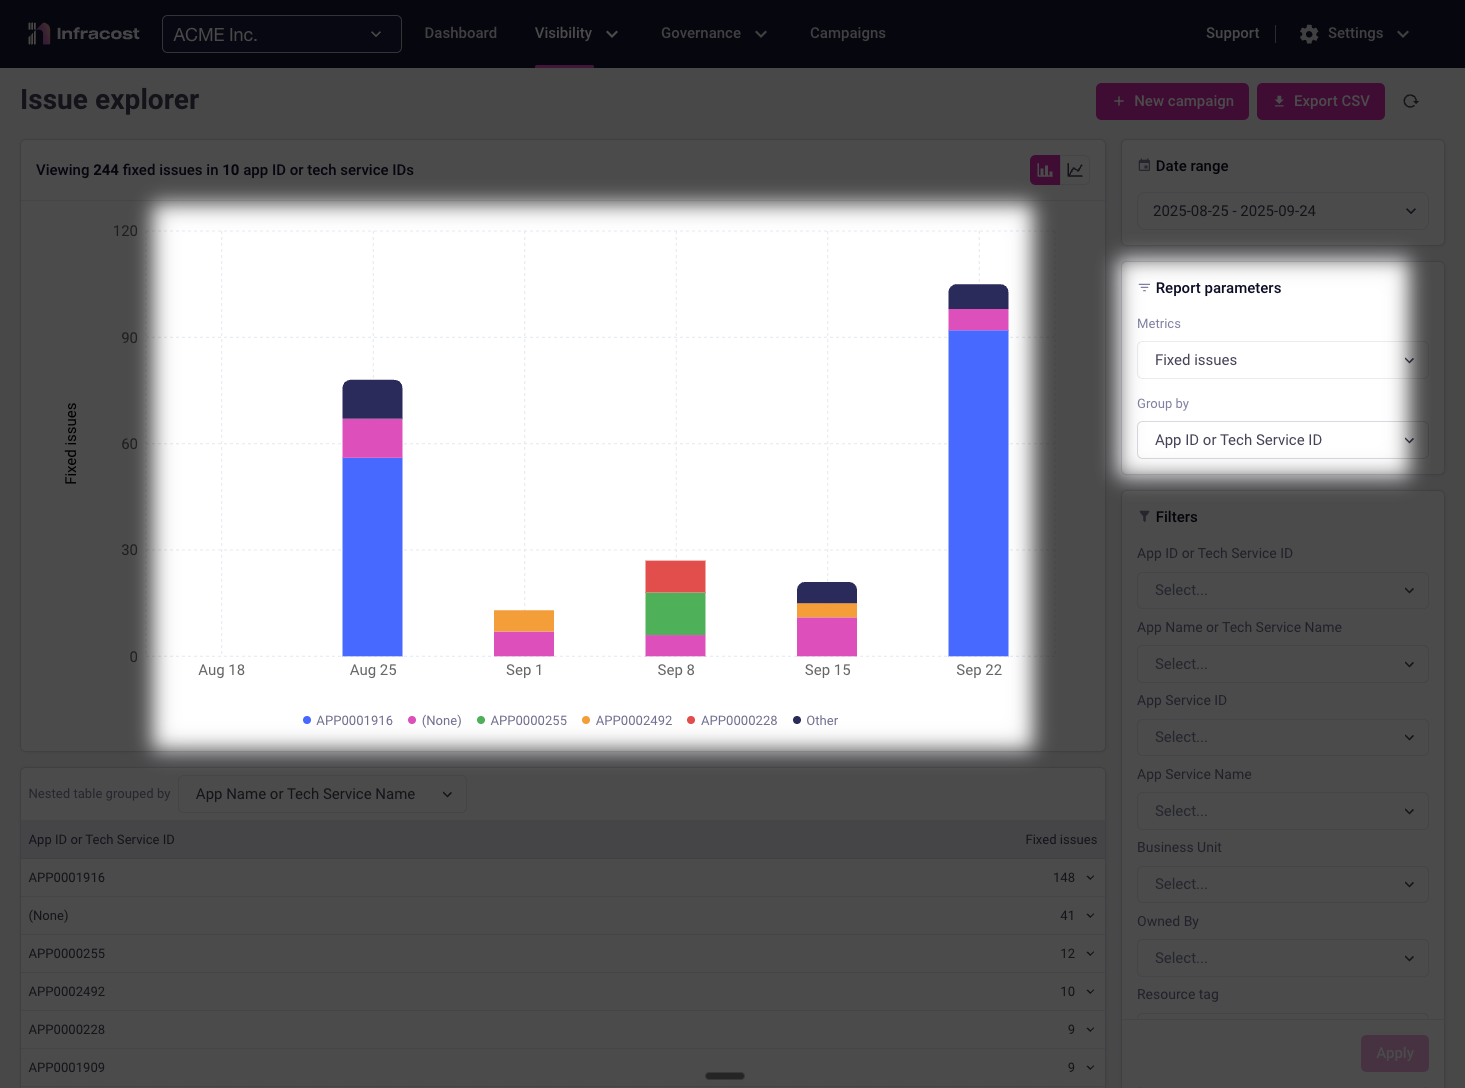
Grouping fixed issues by application showcases where your remediation efforts are succeeding and helps you understand team effectiveness.
This data becomes powerful evidence for resource allocation decisions, team recognition, and identifying where additional training or tooling investment would have the most impact.
Turning Insights into Campaigns
When your analysis reveals patterns in open issues—whether concentrated in specific teams, applications, or policy types—campaigns transform these insights into coordinated action.